
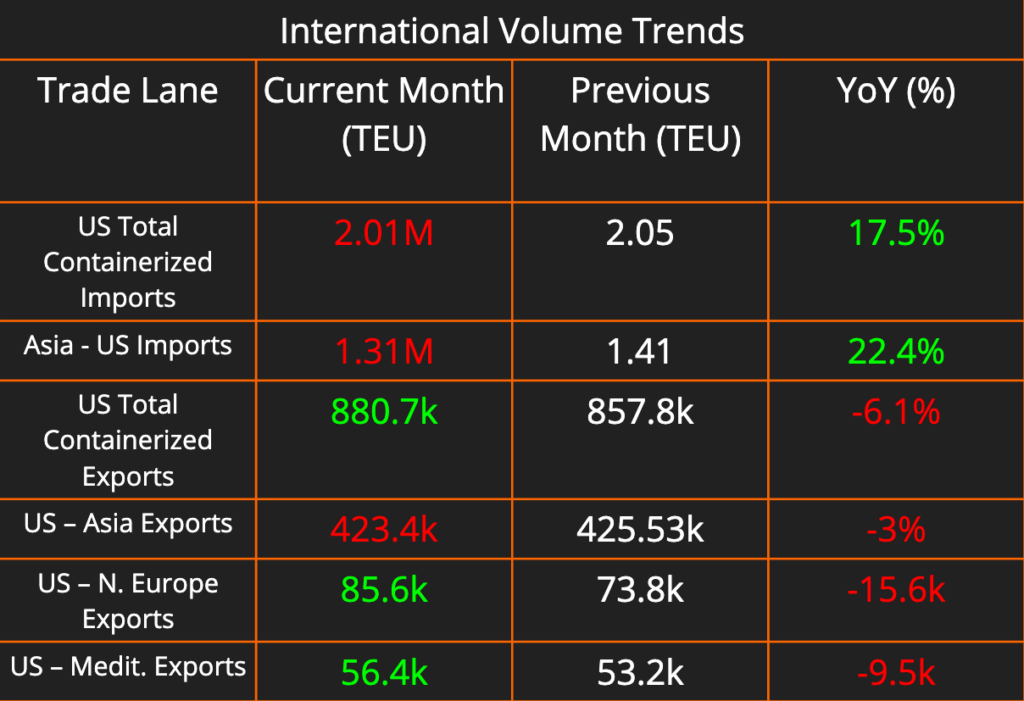
This week’s newsletter brings you a comprehensive look at the shipping and logistics landscape. The monthly data on containerized imports and exports shows a general decline in US import activity and a month-over-month increase in US exports, driven by steady increases to Europe. Domestic shipping prices saw no significant fluctuations this week. Fuel costs decreased in every market, continuing a trend of falling fuel rates.
We explored the findings from Maersk’s most recent earnings call, and what Maersk’s findings say about the industry as a whole. Finally, we covered the year-over-year boom in container volumes at US ports.

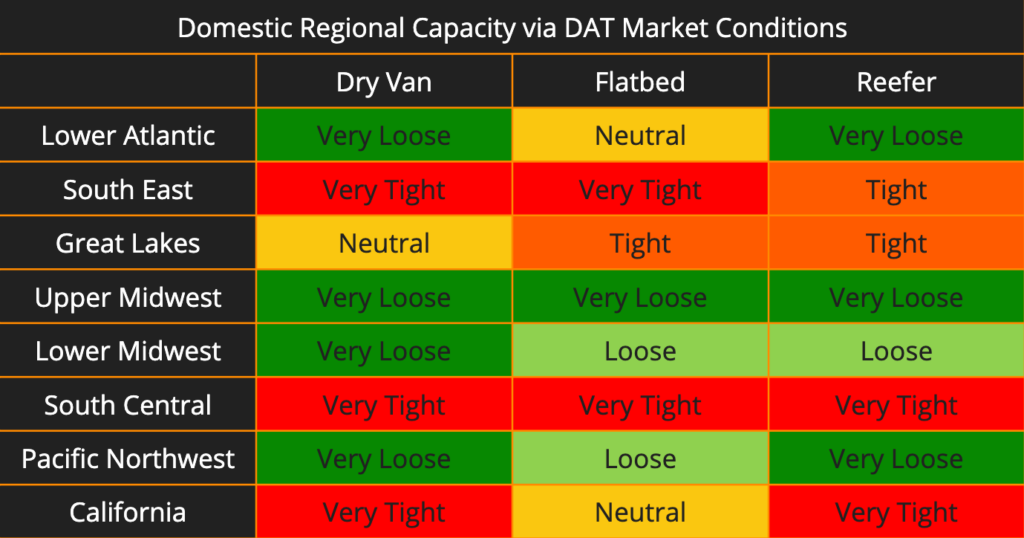
There are not many changes to our Domestic Regional Capacity tracker week-over-week. The Midwest continued to see loosening capacity, with all regions and modes showing as Loose or Very Loose. California capacity continues to tighten up in Dry Van and Reefer, with Flatbed remaining neutral compared to last week. The Great Lakes region’s Flatbed capacity has begun to tighten.
Strong Demand and Red Sea Disruptions Result in Increased Ocean Rates
Maersk’s first-quarter results offer a glimpse into a container shipping industry in flux. While demand continues to surge, particularly outside traditional peak seasons, it’s not enough to fully offset the return to normalcy from 2022’s record highs.
Demand Spreads Across Trade Lanes:
One development is the ripple effect of disruptions in the Red Sea, where attacks have forced ships to reroute around Africa. As we have predicted in earlier articles, the disruptions in the Red Sea have resulted in rate increases on other trade lanes. This is due to a global shortage of capacity that’s struggling to keep pace with an unexpected surge in demand.
Despite traditionally being a slow period, Maersk, the second largest ocean carrier and a bellwether for the industry, reports significant year-over-year volume growth across various trade lanes. Asia-North America saw a jump of nearly 28%, while West Africa and Latin America experienced increases of 18% and 22% respectively. This unseasonal demand is straining existing capacity and contributing to rising rates beyond just the Red Sea-affected routes.
Financial Performance Reflects Normalization:
Maersk’s financials reflect the industry’s normalization from the record-breaking year of 2022. While first-quarter revenue remained healthy at $12.4 billion, it’s down 13% year-over-year. Profits also declined significantly compared to the exceptional performance of Q1 2023.
A Look at the Numbers:
- Revenue: $12.4 billion (down 13% YoY)
- EBITDA: $1.6 billion (down 60% YoY)
- EBIT: $177 million (down 92% YoY)
- Net Profit: $208 million (down 91% YoY)
Red Sea Impact: Higher Rates but Lower Profits:
While average rate levels fell 18% year-over-year due to normalization, they did increase 23% compared to the previous quarter. This reflects the impact of Red Sea surcharges imposed by Maersk to recoup costs associated with the longer routes. While the current situation benefits carriers like Maersk due to high demand and rerouting, the specter of overcapacity remains. Clerc warns that even with extended Red Sea disruptions, the new ship orders could outpace projected market growth, leading to potential challenges in the future.
US Ports Boom: Major Hubs See Volume Surge Amidst Global Trade Uncertainty
Major US ports are experiencing a boom in activity, defying whispers of a global trade slowdown. Here’s a look at the latest data on container volume growth at key East Coast, West Coast, and Gulf Coast gateways:
West Coast:
- Los Angeles: The nation’s busiest port continues its dominance, reporting a staggering 12% year-over-year (YoY) increase in container volume compared to 2023.
- Long Beach: Los Angeles’ neighbor isn’t far behind, with a healthy 10% YoY jump in container traffic.
- Oakland: California’s third-largest container port is also witnessing strong growth, with a reported 8% increase in YoY container volume.
- Seattle: The Pacific Northwest gateway of Seattle rounds out the West Coast with a significant 5% YoY increase in container volume.
East Coast & Gulf Coast:
Major ports on the East and Gulf Coasts are also seeing significant surges:
- New York/New Jersey: The combined port complex of New York and New Jersey, the nation’s second-busiest, is experiencing a healthy 6% YoY increase in container volume.
- South Carolina: South Carolina’s ports, a vital entry point for goods headed to the southeastern US, are reporting a strong 4% YoY growth in container traffic.
- Georgia: Georgia’s ports, another key player in the Southeast, are also seeing positive movement with a 3% YoY increase in container volume.
- Houston: Moving to the Gulf Coast, Houston, a hub for energy and manufacturing exports, is experiencing a robust 7% YoY growth in container traffic.
This surge in activity at major US ports stands in contrast to the potential moderation in global trade growth predicted by some analysts. While the global market might see a slowdown, it’s important to understand that this doesn’t necessarily translate into a decline. Positive growth is still anticipated, just at a more measured pace.
Several factors contribute to the strong demand at US ports. The ongoing post-pandemic recovery is a significant driver, with American consumers continuing to spend at a healthy clip. Additionally, ongoing supply chain disruptions in other parts of the world might be unintentionally benefiting US ports. With global shipping routes facing bottlenecks, some cargo is likely being diverted to US ports for more efficient flow and stability.