
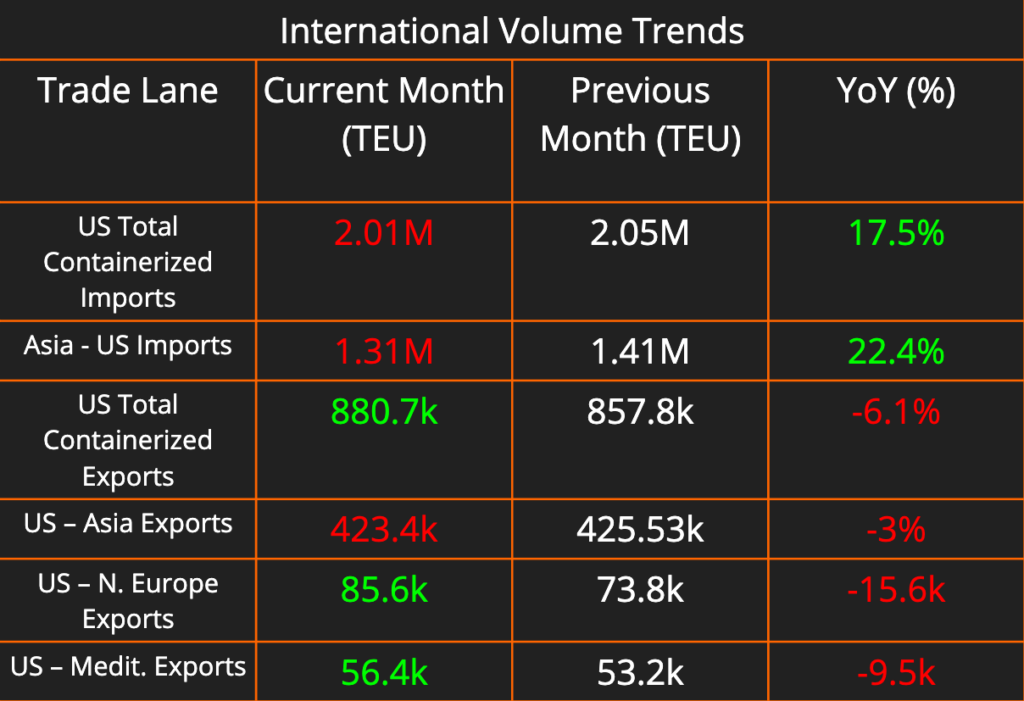
This week’s newsletter dives into the latest trends shaping the shipping and logistics landscape. While US import activity shows a decline, exports are on the rise, particularly to Europe. Domestic shipping costs are climbing across all modes, but a silver lining appears with continued drops in fuel prices.
We’ll also explore the recent flurry of activity by steamship lines establishing direct routes to Mexico, fueled by the growing trend of nearshoring. Finally, we investigate the strategies of large carriers as they reduce their fleets and analyze how these actions impact the overall market capacity and freight rates.


There were no changes to capacity in the California, South Central, Southeast, and Great Lakes regions. Lower Atlantic capacity changed to Very Loose for Flatbed. Reefer capacity changed to Neutral from Loose in the Lower Midwest. Flatbed capacity changed to Very Loose from Loose in the Pacific Northwest. Continuing the trend from several consecutive weeks, the South Central, California, and Southeast have remained red hot due to the demand to get to those regions.
New Shipping Routes Bridge Asia-Mexico Trade Boom, Fueled by Nearshoring
The winds of change are blowing across the Pacific Ocean, with major shipping lines like MSC, CMA CGM, and Cosco establishing express routes directly connecting Asian giants like China, South Korea, and Japan to key Mexican destinations. This flurry of activity underscores a burgeoning trade relationship between the two regions, driven in part by the growing trend of nearshoring.
Nearshoring, the strategic relocation of manufacturing operations to geographically closer locations, lies at the heart of this trade boom. Companies in the United States are increasingly looking to Mexico as a viable alternative to China due to factors like reduced transportation costs, lead times, and duty rates. This shift in manufacturing strategies has fueled a surge in import container bookings from Asia to Mexico, with bookings from China alone skyrocketing in the past year.
Adding fuel to the fire is the significant and growing investment by Chinese companies in Mexico. According to the article, Chinese direct investments reached a staggering $135 billion in 2023, an 11% jump year-over-year.
The new express shipping services address this growing demand by eliminating the need for transshipment through intermediary ports. For example, Cosco Shipping Lines and OOCL’s new Transpacific Latin Pacific 5 (TLP5) route directly links Asian ports with the Mexican hubs of Manzanillo and Lazaro Cardenas. Similar direct routes established by other carriers aim to streamline cargo movement and potentially shorten delivery times.
Large US Truckload Carriers Hit the Brakes: Capacity Cuts Amidst Cooling Market
Large US truckload carriers are aggressively trimming their fleets and slowing down hiring in response to a cooling freight market. The Journal of Commerce Truckload Capacity Index (TCI), a key metric for gauging large carrier capacity, reflects a significant decline, dropping 7.7 percentage points in the third quarter of 2024. Since the TCI’s peak in the second quarter of 2022, the publicly owned carriers in the index have cut their collective truck count by 15.4%. The last time the TCI dipped below 80 was in the fourth quarter of 2017, leading to a major capacity crunch in 2018. The current decline signifies a deliberate effort by large carriers to right-size their fleets and align capacity with present demand levels.
However, the trend of tightening capacity among large carriers needs to be viewed in the context of the overall market. More than 201,000 interstate trucking companies gained an operating authority between December 2019 and December 2022, according to Federal Motor Carrier Safety Administration data. As of April, of this year, nearly 36,000 of those authorities had been dropped. That leaves more than 160,000 more authorities and carriers on the road than existed at the end of 2019.
The supply of capacity in the market is inherently linked to the rates that carriers can demand on their services. While spot and contract rates remain healthy compared to historical averages, they have fallen significantly from their record highs in 2021 and 2022. Spot rates have experienced a correction, with some lanes seeing double-digit declines compared to 2023. Contract rates have declined modestly compared to spot rates, offering some relative stability for carriers during this market correction. Many large carriers, seeing that contract rates represent locking in unsustainable contract pricing, have declined to participate in bidding cycles in favor of reducing their fleets and improving their operating ratios.
The future of freight rates remains shrouded in some uncertainty. While some analysts predict a continued downward trend in spot rates, others suggest they might stabilize at a level above pre-pandemic norms. The overall health of the economy and the trajectory of fuel costs will likely play a significant role in determining the direction of rates.